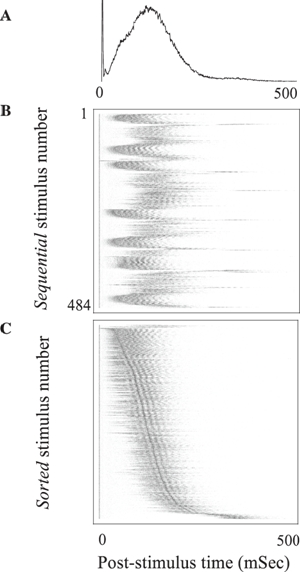
Figure 3.
Latencies to population responses. A: Population post-stimulus time histogram (pPSTH). A total of 52 electrodes in which spikes were detected in >15% of the stimuli were considered for this analysis. The number of spikes recorded in a time window of 500 ms following each of 484 stimuli was registered in 1 ms time bins, averaged, normalized to peak, and plotted in black line; the absolute value at the peak ∼100 ms is ∼4 spikes/ms per 52 electrodes. The stimuli were applied from a single stimulation site at a frequency of 0.3 Hz. B: Horizontal lines, coded by a gray-scale in which maximal spike counts are depicted black, show the responses to each of the 484 individual stimuli. Note trial-to-trial variations. C: The individual responses of panel 3B, sorted based on their time to peak. Note the range and multiplicity of time-scales involved. Figure by permission from reference 39.