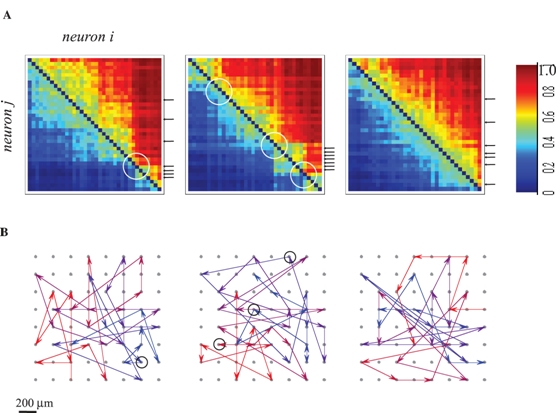
Figure 4.
Demonstration of neuronal stations through which activity is required to pass in order to propagate further into the network. A: Pair-order probability matrices, generated from responses to three different stimulation sources of one network: The matrices (each for one of the three stimulation sources) depict the probability (color-coded) of each neuron to precede every other neuron. Neurons are presented in these matrices sorted by their average rank. White circles depict the impact of presumed bottle-necks outside the sampled area. Small black arrows to the right of the middle panel depict a cluster of neurons that tend to respond close to each other in terms of their recruitment order; each arrow indicates one of these neurons. The dispersion of these arrows in the other (right and left) panels indicates that the rank of any given neuron is stimulus site-specific. B: Activation pathways for the three sources shown in A above. The average rank vector of the responses to each source is projected onto a map of the physical locations of each electrode. Note that propagation lines that connect between electrodes that are horizontally or vertically aligned might mask each other and give the impression that a sequence has more than one end-point; to overcome this graphical problem, a color-coding for the rank of each arrow (red to blue) is used. Circles depict physical locations of neurons circled in 4A. Figure taken by permission from reference 39.