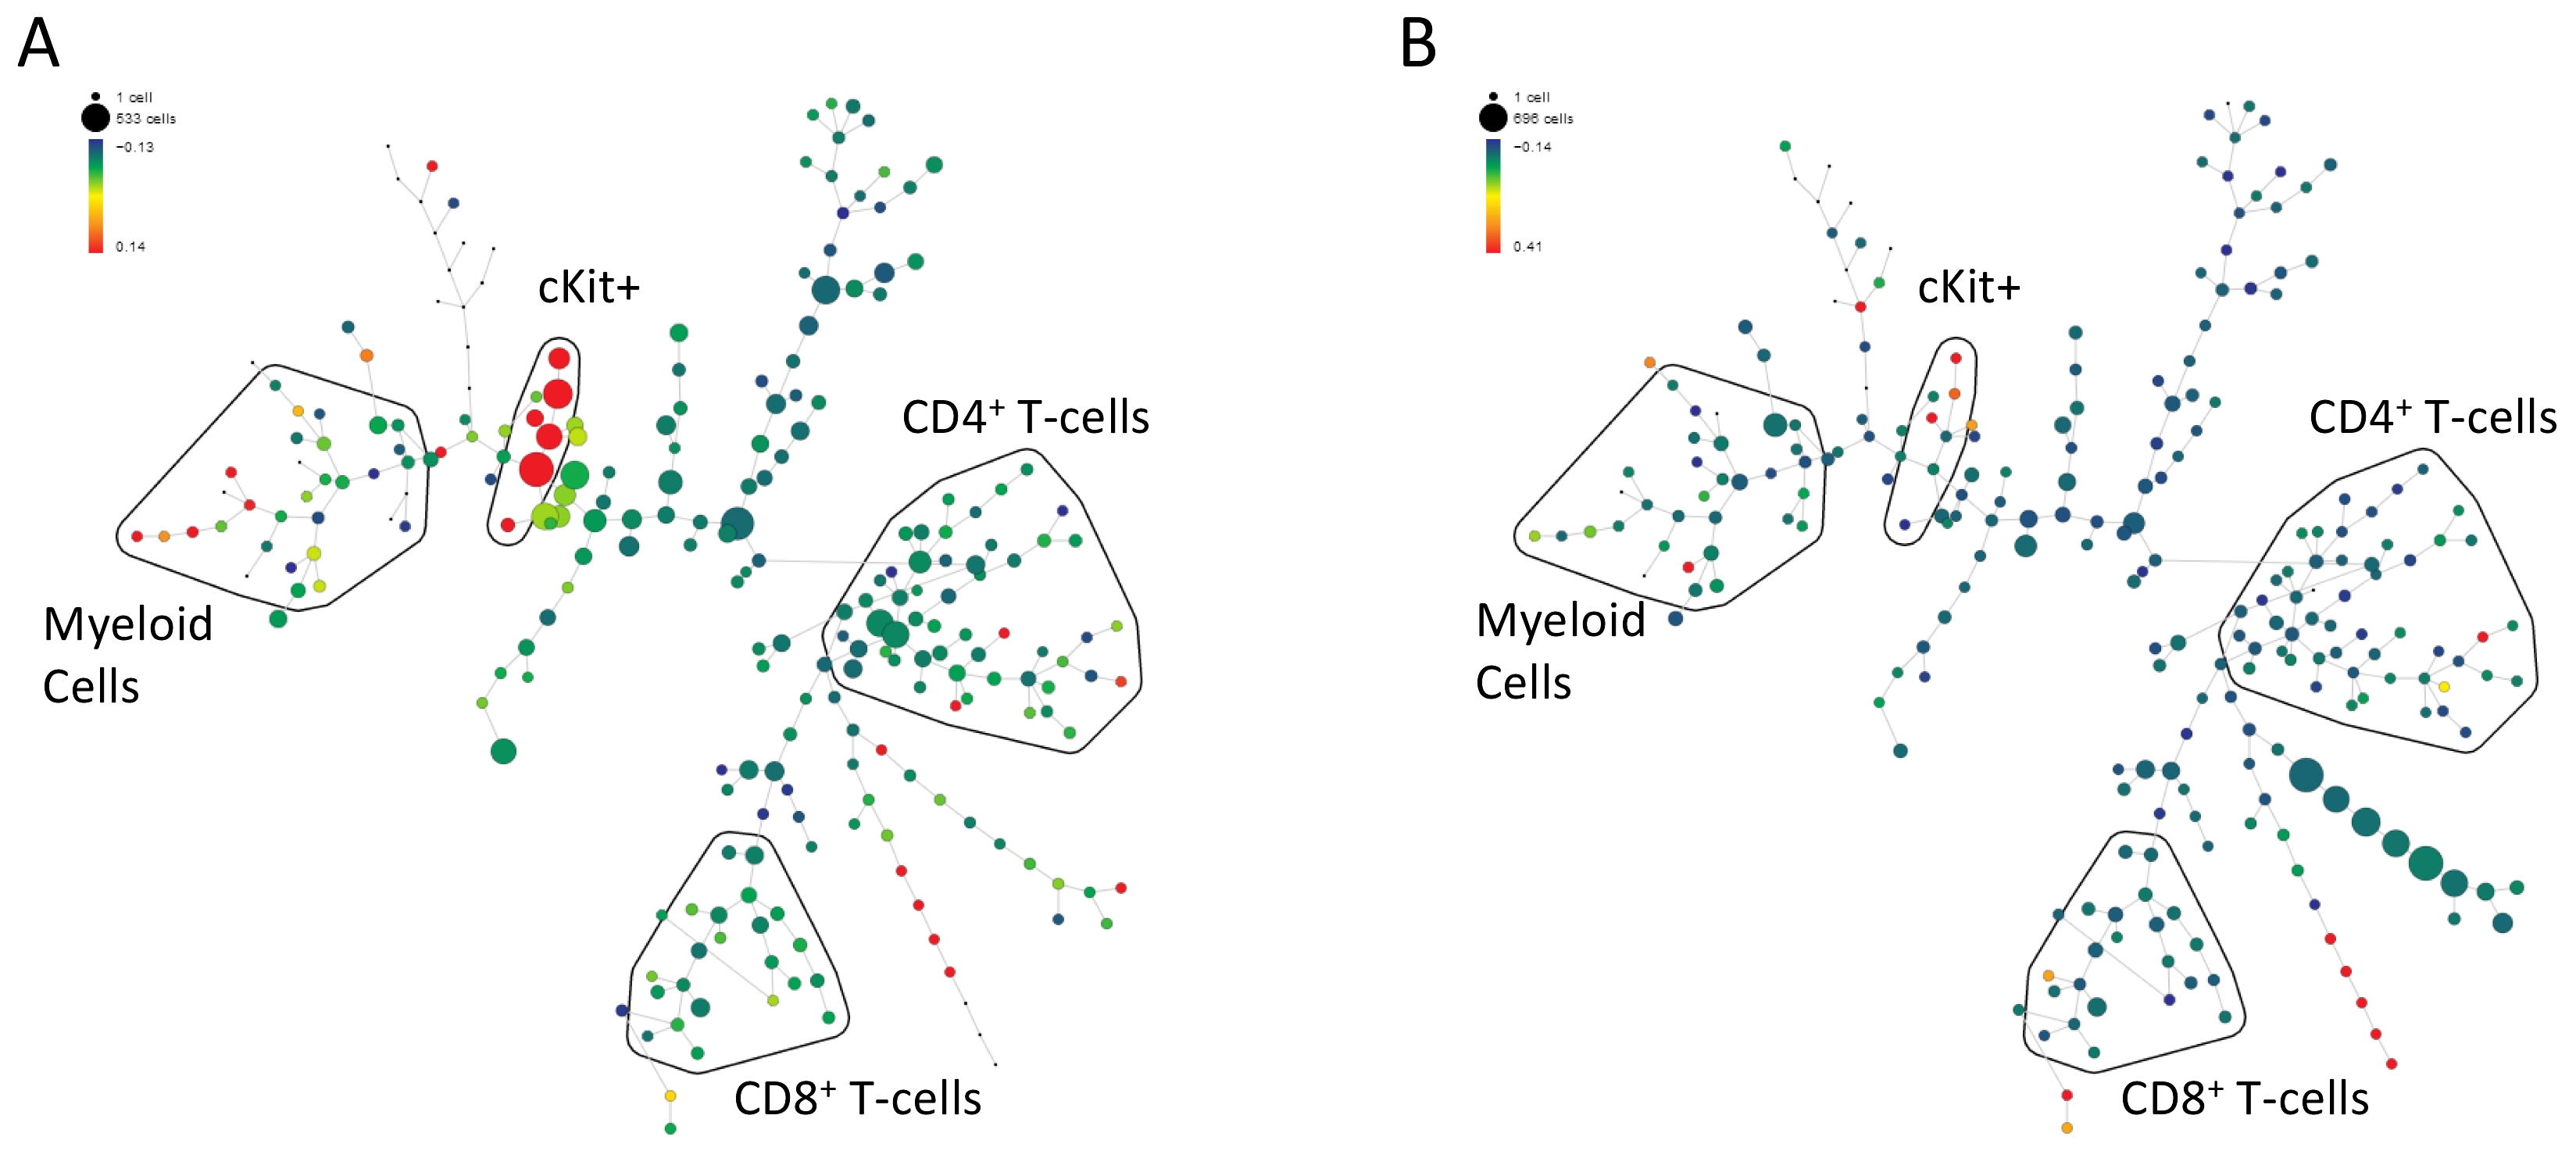
Figure 2.
Mass cytometry captures a snapshot of immune system alterations in cell subset abundance between conditions.
Immunophenotypic differences between human bone-marrow samples of a cancer patient taken (A) pre- and (B) post-chemotherapy, measured by mass cytometry using antibodies against 25 cell surface antigens and analyzed and visualized using the SPADE algorithm in a tree plot.4 Antigen abundances define each individual cell measured as a single point in a 25-dimensional space. Individual cells most similar to one another are clustered into one of 200 clusters (nodes) connected by similarity to form a tree-like structure. The size of each node in the tree corresponds to the number of cells that fall into the node, whereas the color is scaled to the median intensity of marker expression of the cells within each node (cKit is shown). Putative cell populations were annotated manually and are represented by colored lines encircling sets of nodes that have CD marker expression emblematic of the indicated subset designations. Significant changes in cell subsets pre- and post-chemotherapy are observed both in the drastic reduction in cell subset population sizes (compare size of individual nodes between A and B) and intensity of cKit expression (compare color between A and B).