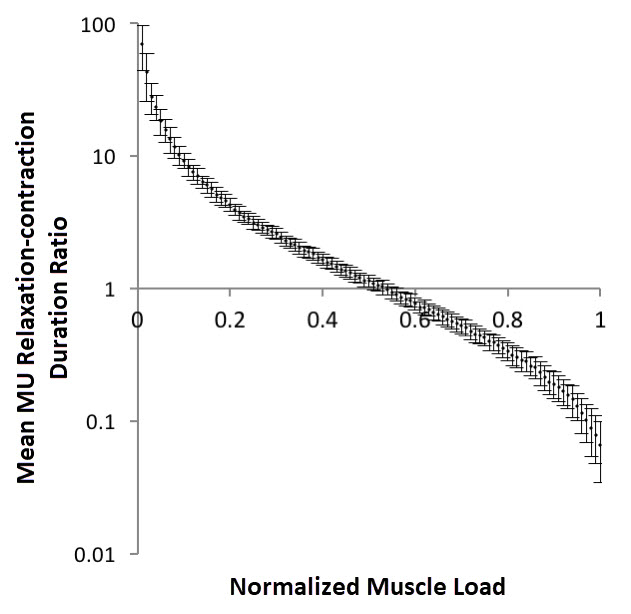
Figure 1. The Effect of Muscle Load on Average Motor Unit Relative Relaxation Time
The figure represents the results of multiple simulated loadings of a single phasic muscle, with increasing loads, whose sizes are represented here as a fraction of the muscle’s maximum loading capacity (x-axis). Relative MU relaxation time, calculated as mean relaxation time/mean contraction time, is represented in the y-axis. Mean of 100 simulations, bars represent standard deviation. (MU, motor units).