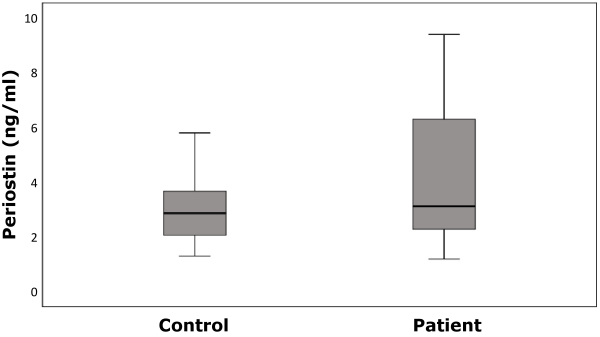
An external file that holds a picture, illustration, etc., usually as some form of binary object. The name of referred object is rmmj-12-3-e0021-g001.gif

Figure 1.

Periostin Levels in the Patient and Control Groups.

Data distribution is shown in the box-plot. The lowest point is the minimum of the data set, and the highest point is the maximum of the data set. The box is drawn from Q1 to Q3 with the horizontal line denoting the median.

RMMJ Rambam Maimonides Medical Journal Rambam Health Care Campus 2021 July; 12(3): e0021. ISSN: 2076-9172
Published online 2021 July 20. doi: 10.5041/RMMJ.10440