The frequently reported “lifetime risk” of cancer statistics has two main limitations: it may not indicate the important statistics that may be the main concern of patients and physicians, i.e. the cancer risk in the past up to a certain age, and in the future from a specific age to life expectancy. We can suggest “cancer risk in the past risk (CRIP)” and “cancer risk in the future (CRIF)” as names for the suggested new measures.
In this paper, we propose two new measures that can be used to address these issues of interest. These measures can easily be calculated from the published statistics of national registries and are applicable for individuals at any age. The proposed new measures are clinically oriented. They provide information that may be useful to patients and physicians, and can be interpreted and used straightforwardly.
Our analyses indicate that relevant cancer risk estimates from birth to a specific age, or from a specific age to life expectancy, or the average risk in a specific age group, are all considerably lower than the frequently quoted 33% lifetime cancer risk. Similarly, breast cancer risk estimates at specific ages are different from the frequently quoted estimated odds of 1 in 8 or 1 in 9 women. These lower cancer probabilities have important implications for individuals, and also for the public health system in terms of predicting the health resources required for cancer patients.2,7,12 These two estimates are also more informative than the lifetime risk estimates and more relevant to individuals at any specific age.
The future cancer probability from a specific age could be used to assess an individual’s probability of being diagnosed with cancer in the future, and the probability can be modified by considering risk factors such as smoking, family history, etc. This statistic may have implications on a person’s future productivity, potential insurance calculations, and the public health system’s estimates of medical services allocation and planning, per each age.
The past cancer probability up to a specific age could be used to assess the excess of cancer occurrence in populations and individuals, in litigations, occupational settings, and toxic tort litigations.16 For example, the present cancer probability of a person who has been diagnosed with cancer could be compared with that of having cancer in the past up to his/her present age. In toxic tort litigations, for a group of persons who have been diagnosed with cancer, the median age of diagnosis could be compared to the probability of cancer until that age in the general population, based on the cancer registry.
Bender et al.17 noted the limitations of the lifetime risk measure and suggested new population measures, that is, the cumulative risk for an entire cohort, using lifetable methodology, to estimate a quantitative index of the cancer burden in the community (e.g. a state). They indicated that their new measure estimates the population cancer risk (PCR) and expresses it as the number of expected cancers in the lifetimes of 1,000 people. This index has applications in program planning, communicating the risk of cancers, and descriptive epidemiology. Our measures are applicable for individuals, rather than populations, as suggested by Bender et al., and may be more informative in clinical settings and thus complement the methodologies mentioned above.
Our methodology is based on published registry data and thus is available to any person or health professional who can access published registry data. Because it uses registry data, it has the same limitations as all registry data, including incomplete ascertainment, possible selection and information bias, or bias due to multiple malignancies in the same person.18
In addition, our calculations in Equations 1–8 are based on specific assumptions, as mentioned, i.e. stable ID in the relevant period and an absence of competing risks. In the calculations, we assumed that the ID for each age group in the past or the future is identical to that in 2013. Future research could attempt to adjust for the rate of change in cancer rates throughout the relevant year periods. However, this limitation in our methodology is similar to any lifetime cancer risk calculations that are currently used. Similar to the commonly used “lifetime risk” measure from birth to life expectancy, our new measures give identical weight to all ages and all age-specific cancer rates. Future research could attempt to standardize these measures, or develop further measures of years of potential life lost based on our suggested measures, as has been suggested by Sasieni and Adams.19
Following SEER,2 we suggest that future research could use our new measures to calculate the risk from any age 10, 20, 30, 40, 50, etc. years ahead, similar to our calculations to age 80 (life expectancy).
Further research could explore the use of our suggested measures: clinicians in one clinic could use these new estimates, and clinicians in a comparable clinic could use the old estimates when talking to their patients, and the pre–post attitudes and behaviors of patients belonging to the two clinics could then be compared. The results could serve as a measure of the feasibility, efficacy, and effectiveness of our suggested new measures, as in other research on other health measures.
We used 80 as an estimate of life expectancy; however, our calculations should be modified for countries or populations with a different life expectancy.2
A limitation of our study is that data for only one year (2013) were used. We used these data as these were the most recent available data of the INCR, and for demonstrating the use of our suggested new measures. Thus, our estimates of risks are limited to this year only. Future research could compare these estimates with those for other years.
Our analyses indicate that relevant cancer risk estimates from birth to a specific age, or from a specific age to life expectancy, are all lower than the frequently quoted lifetime cancer risks. Our estimates may be more informative than the currently used lifetime risk measure, which may overly alarm individuals or decision-makers.1 For example, Hopwood20 indicated that women’s perceptions of breast cancer risk are largely inaccurate and are frequently associated with high levels of anxiety about cancer. Further research could explore the use of our measure in communicating cancer risk. Our age-specific estimates of cancer risks may have important implications in public health settings and in predicting the necessary health resources for cancer patients.
In summary, we suggest that the new measures could complement the published registry “lifetime risk” statistics and potentially provide more relevant information to patients and physicians.

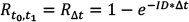 (Eq. 1)
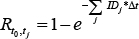 (Eq. 2)
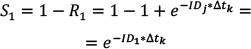 (Eq. 3)
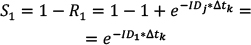 (Eq. 3.1)
 (Eq. 4)
 (Eq. 4.1)
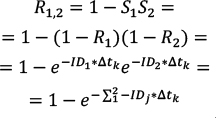 (Eq. 5)
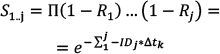 (Eq. 6)
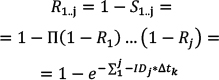 (Eq. 7)
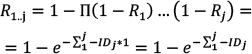 (Eq. 8)